Transform Your Trading with Data-Driven Insights
Track, analyze, and improve your trading performance with our comprehensive trading journal.
Everything you need to trade smarter
Comprehensive tools designed by traders, for traders. Gain the edge you need to succeed.
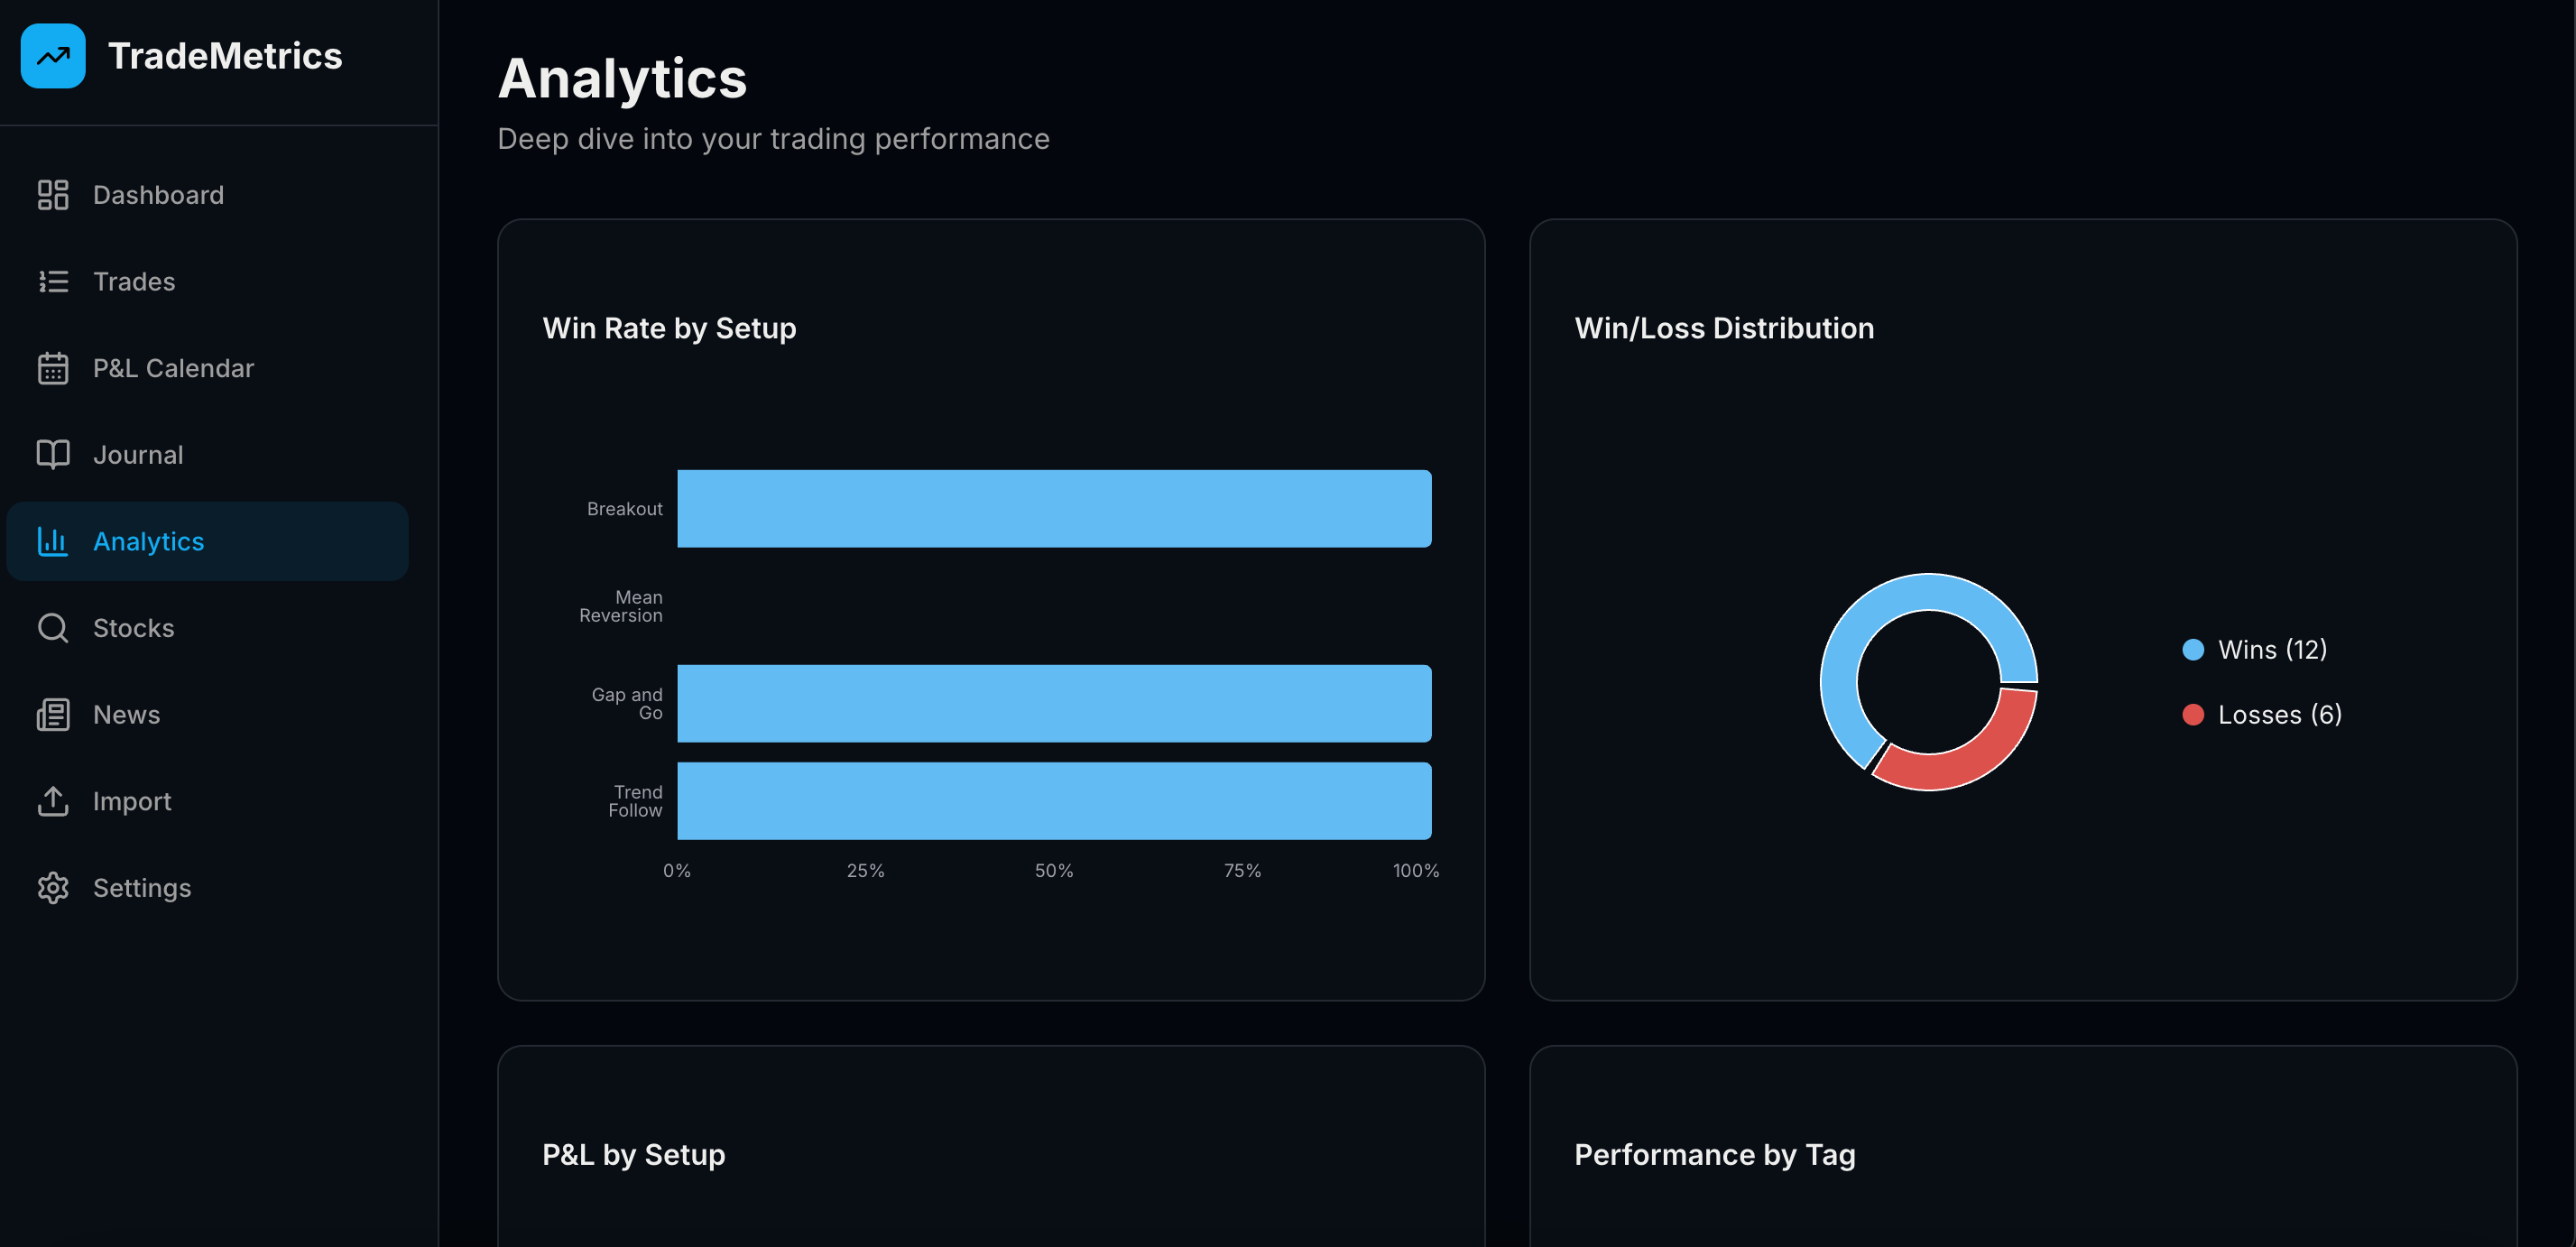
Advanced Analytics
Deep dive into your trading performance with detailed metrics, win rates, profit factors, and custom reports that reveal your strengths and weaknesses.
P&L Calendar
Visualize your daily, weekly, and monthly performance with an intuitive calendar view. Instantly see your profitable and losing days at a glance.
Trading Journal
Document your thoughts, emotions, and market observations. Build a knowledge base of your trading journey with organized sections and tags.
Trade Replay
Review your trades candle-by-candle with our replay feature. Understand your entry and exit timing to make better decisions in the future.
Stock Research
Search and analyze any stock with real-time data, TradingView charts, and key metrics. Build your watchlist and track potential opportunities.
Market News
Stay informed with real-time market news aggregated from top financial sources. Filter by topic and never miss important market-moving events.
See it in action
A powerful yet intuitive interface designed for professional traders
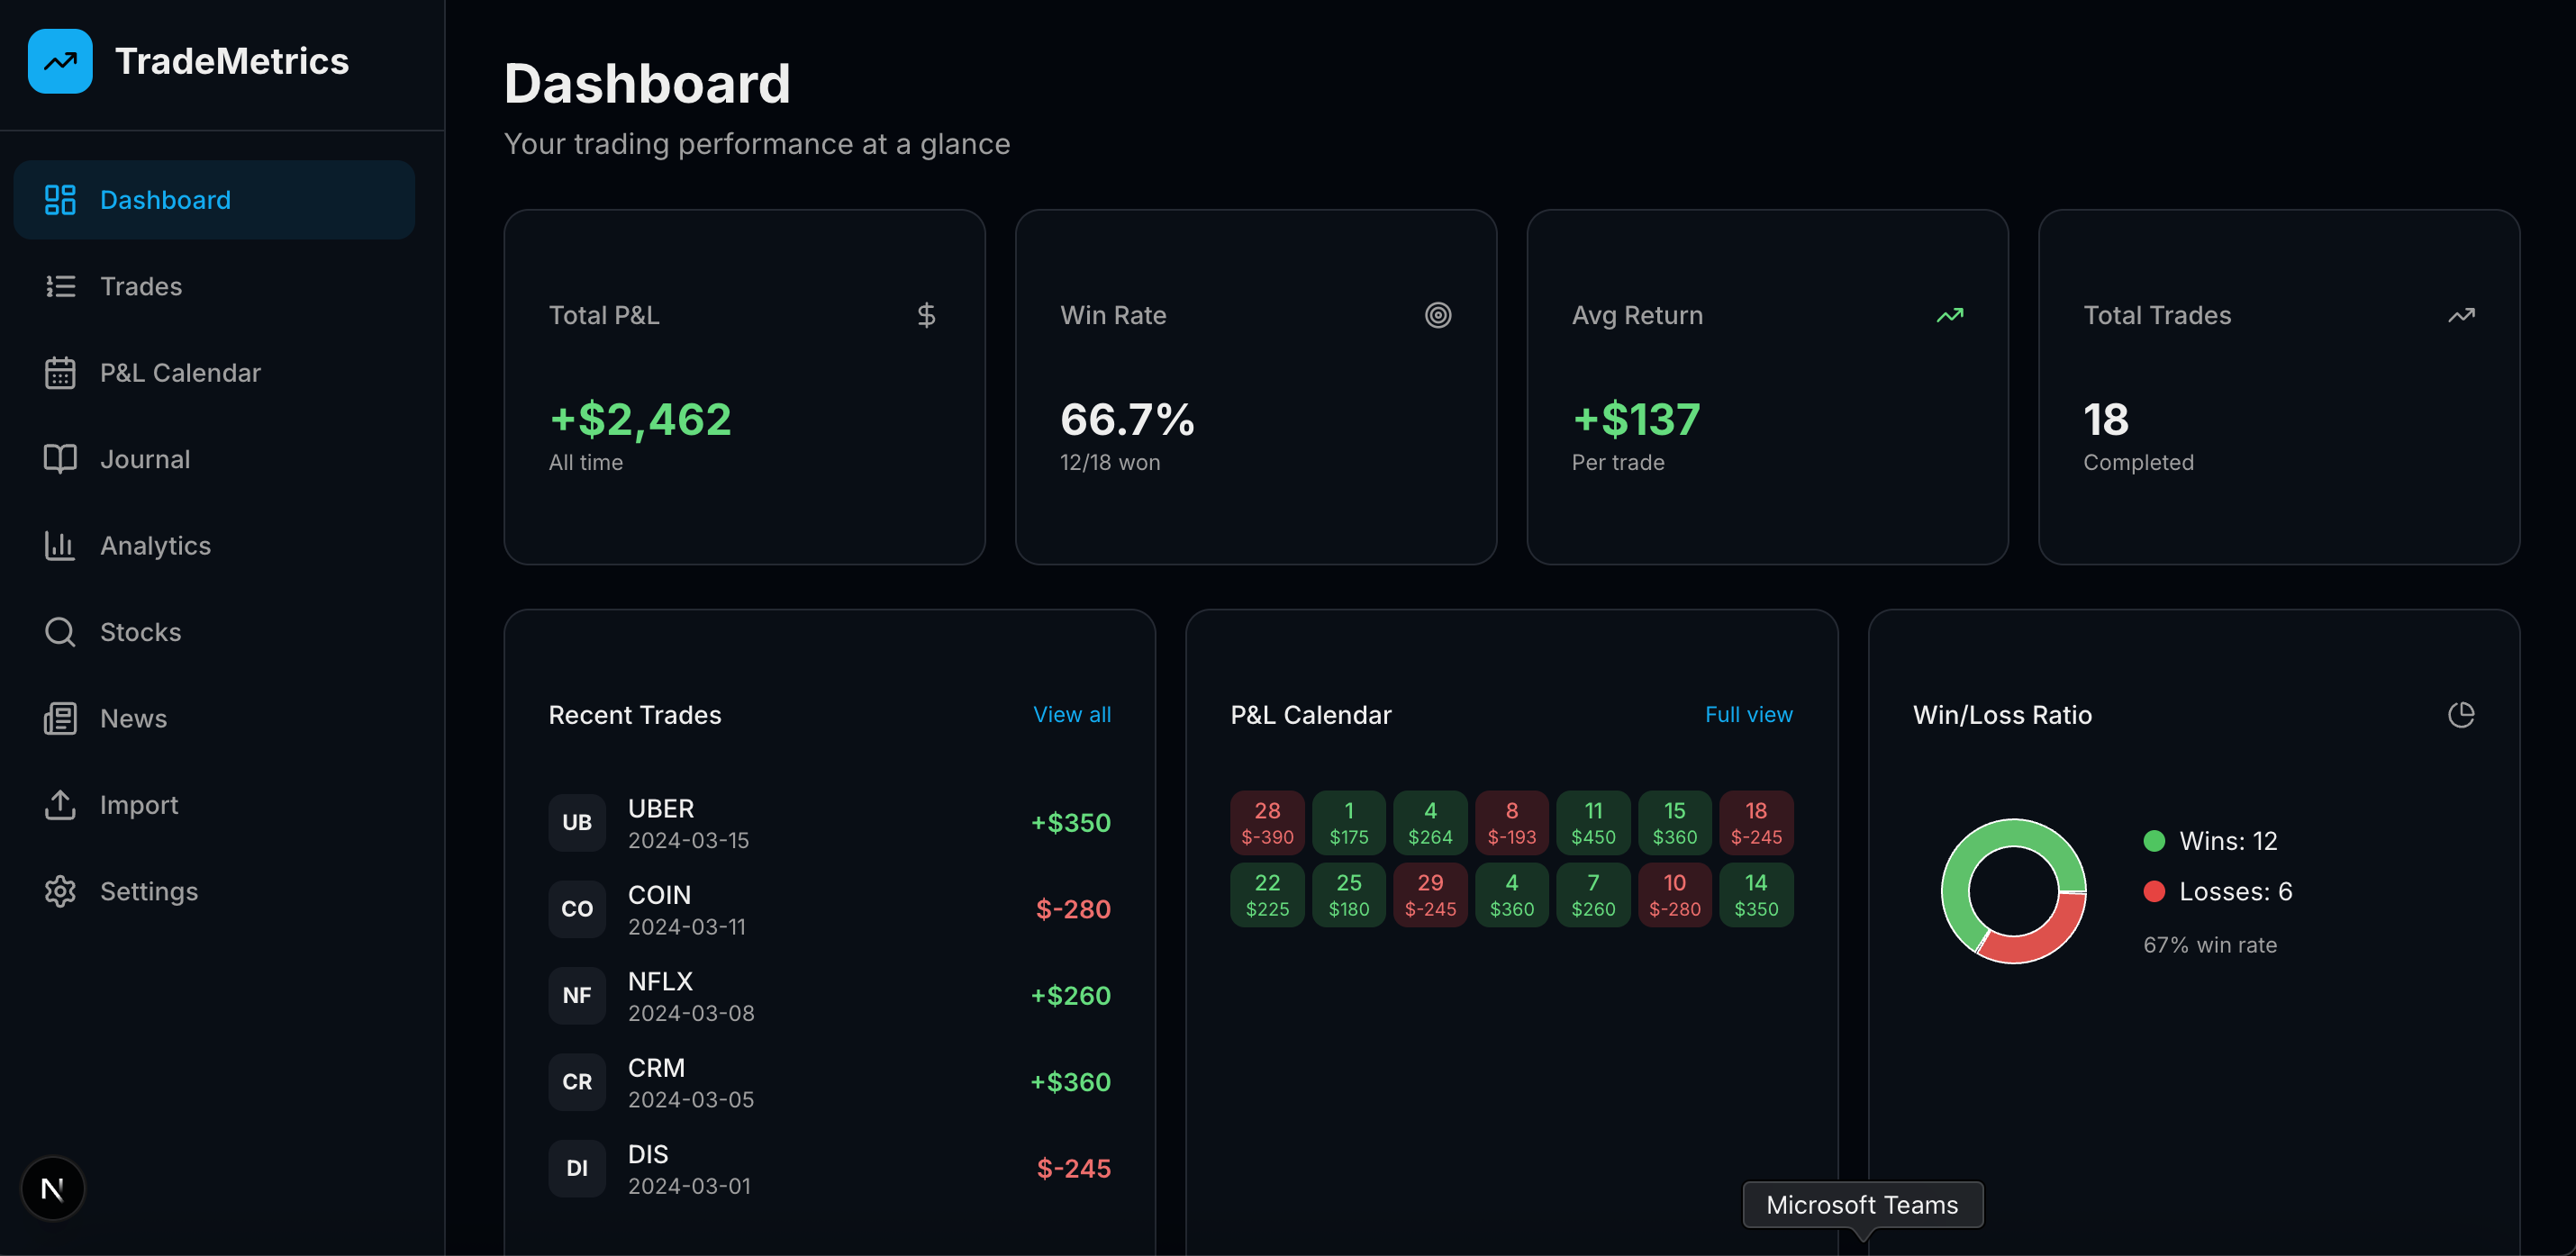
Performance at a glance
Your trading dashboard gives you instant access to key metrics including total P&L, win rate, recent trades, and cumulative performance charts. See your mini P&L calendar and win/loss ratio in dedicated widgets.
- Real-time P&L tracking and statistics
- Cumulative performance visualization
- Quick access to recent trades

Visualize your consistency
See your trading performance mapped to a calendar view. Green days show profit, red days show losses. Identify patterns in your trading behavior and optimize your schedule.
- Daily P&L at a glance
- Monthly performance summary
- Click any day to see trades
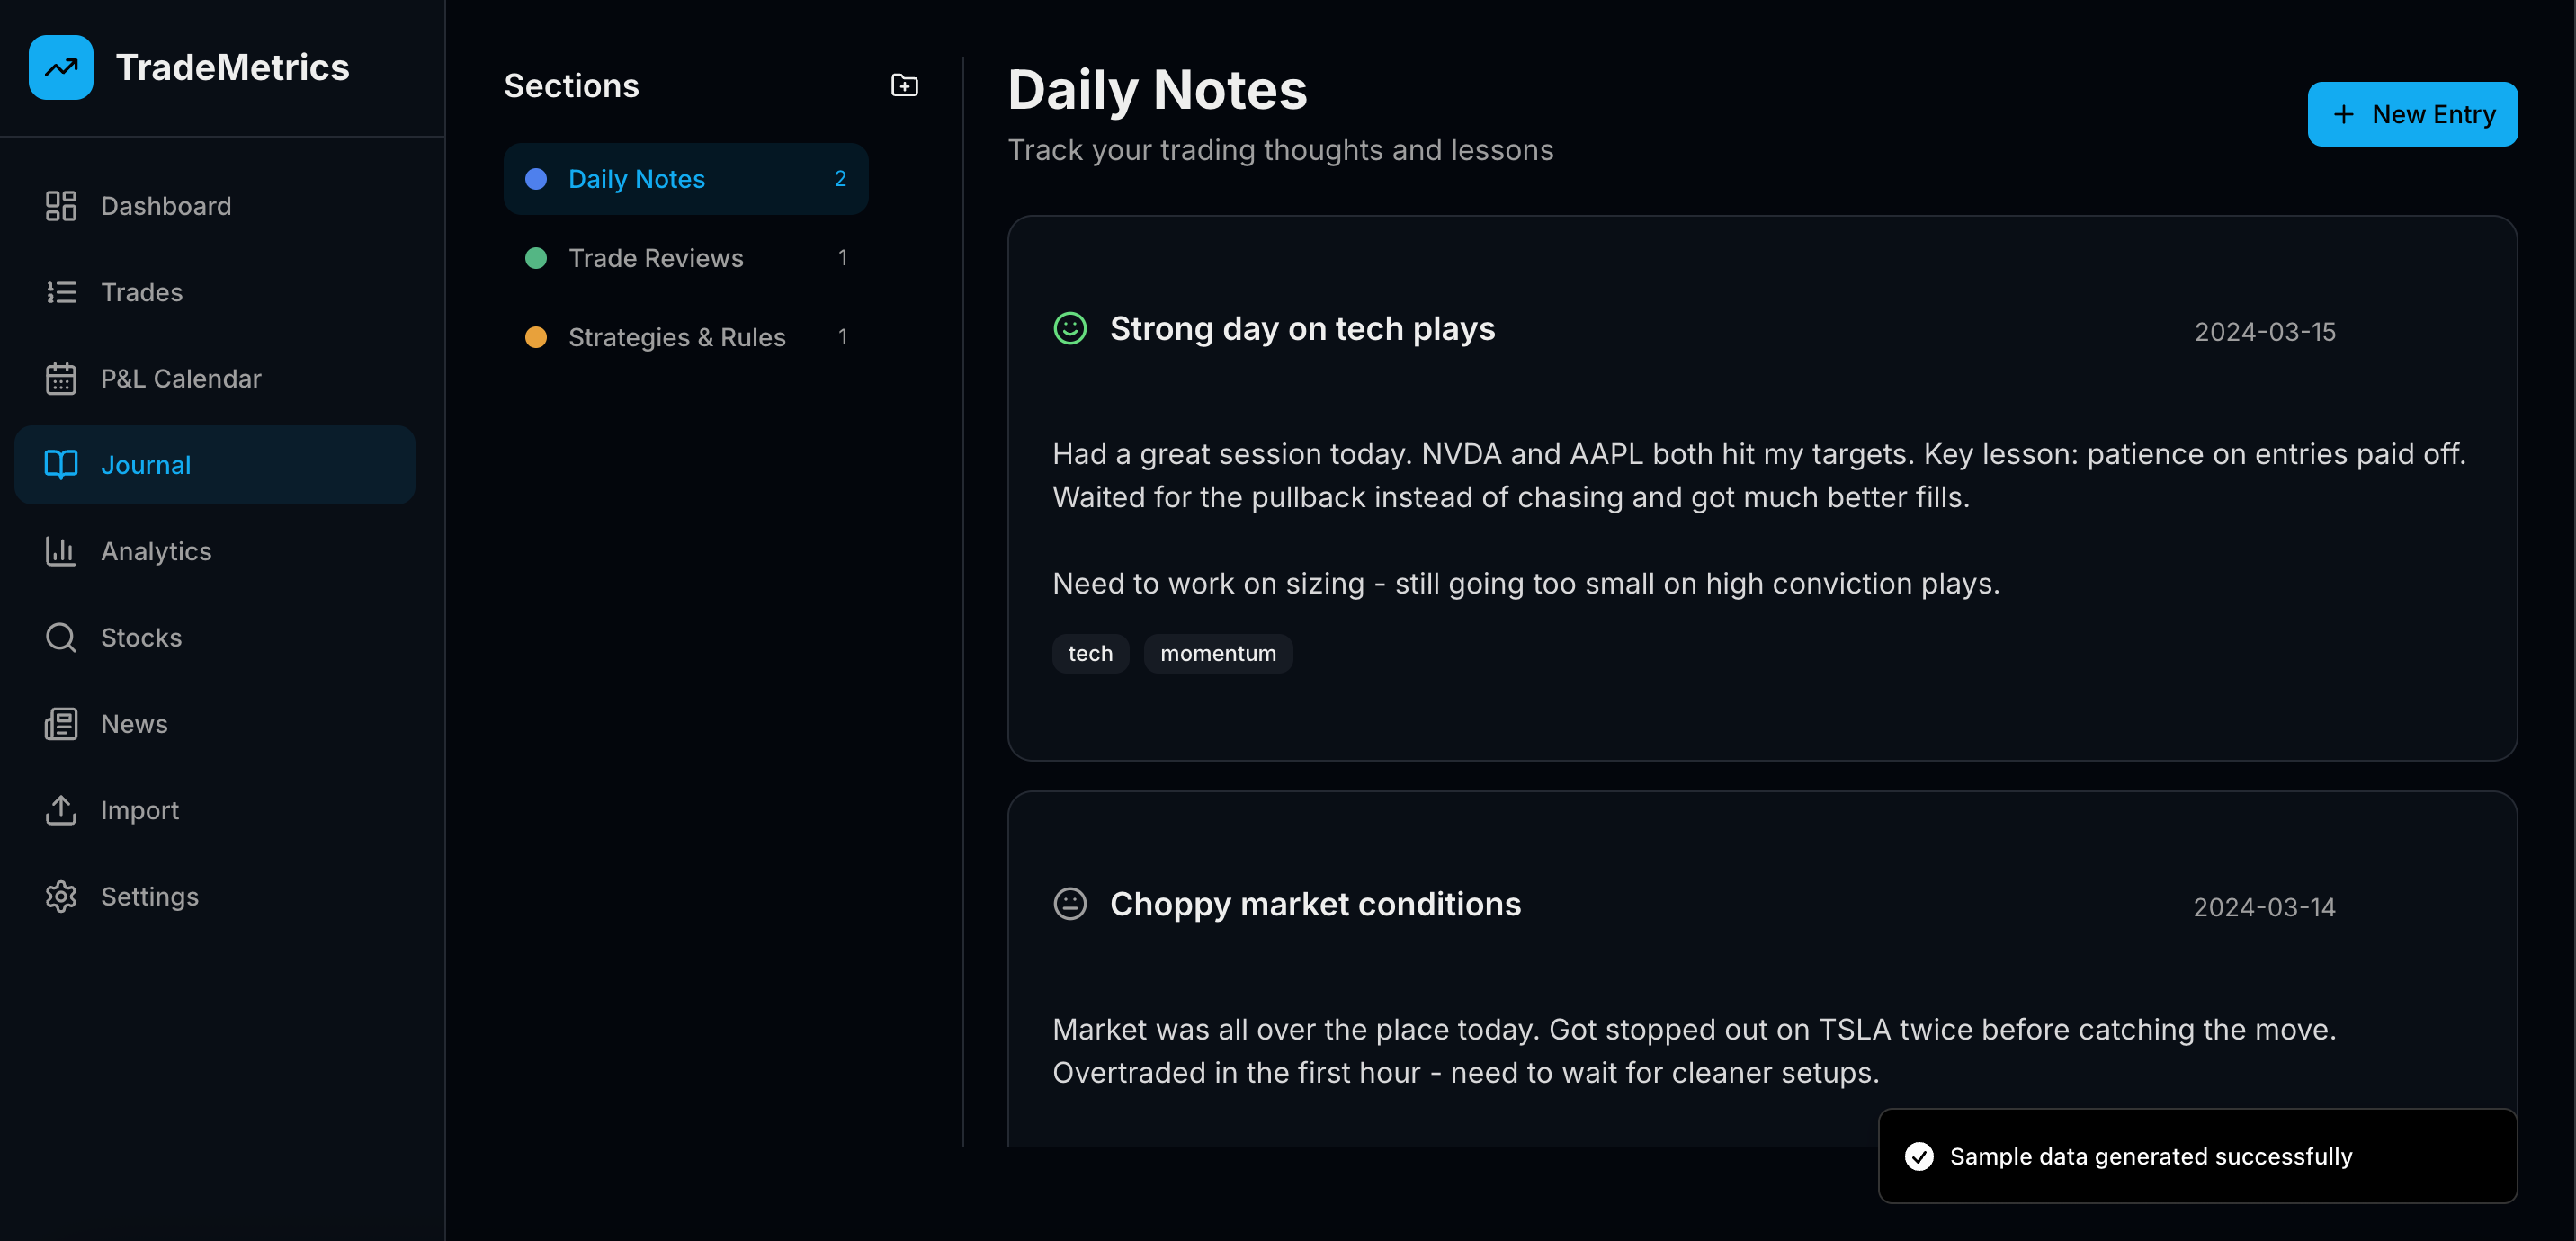
Document your journey
A notebook-style journal inspired by Microsoft OneNote. Create sections, add entries with mood tracking, and build your personal trading playbook with organized notes and insights.
- Organized sections and entries
- Mood and emotion tracking
- Tags and search functionality
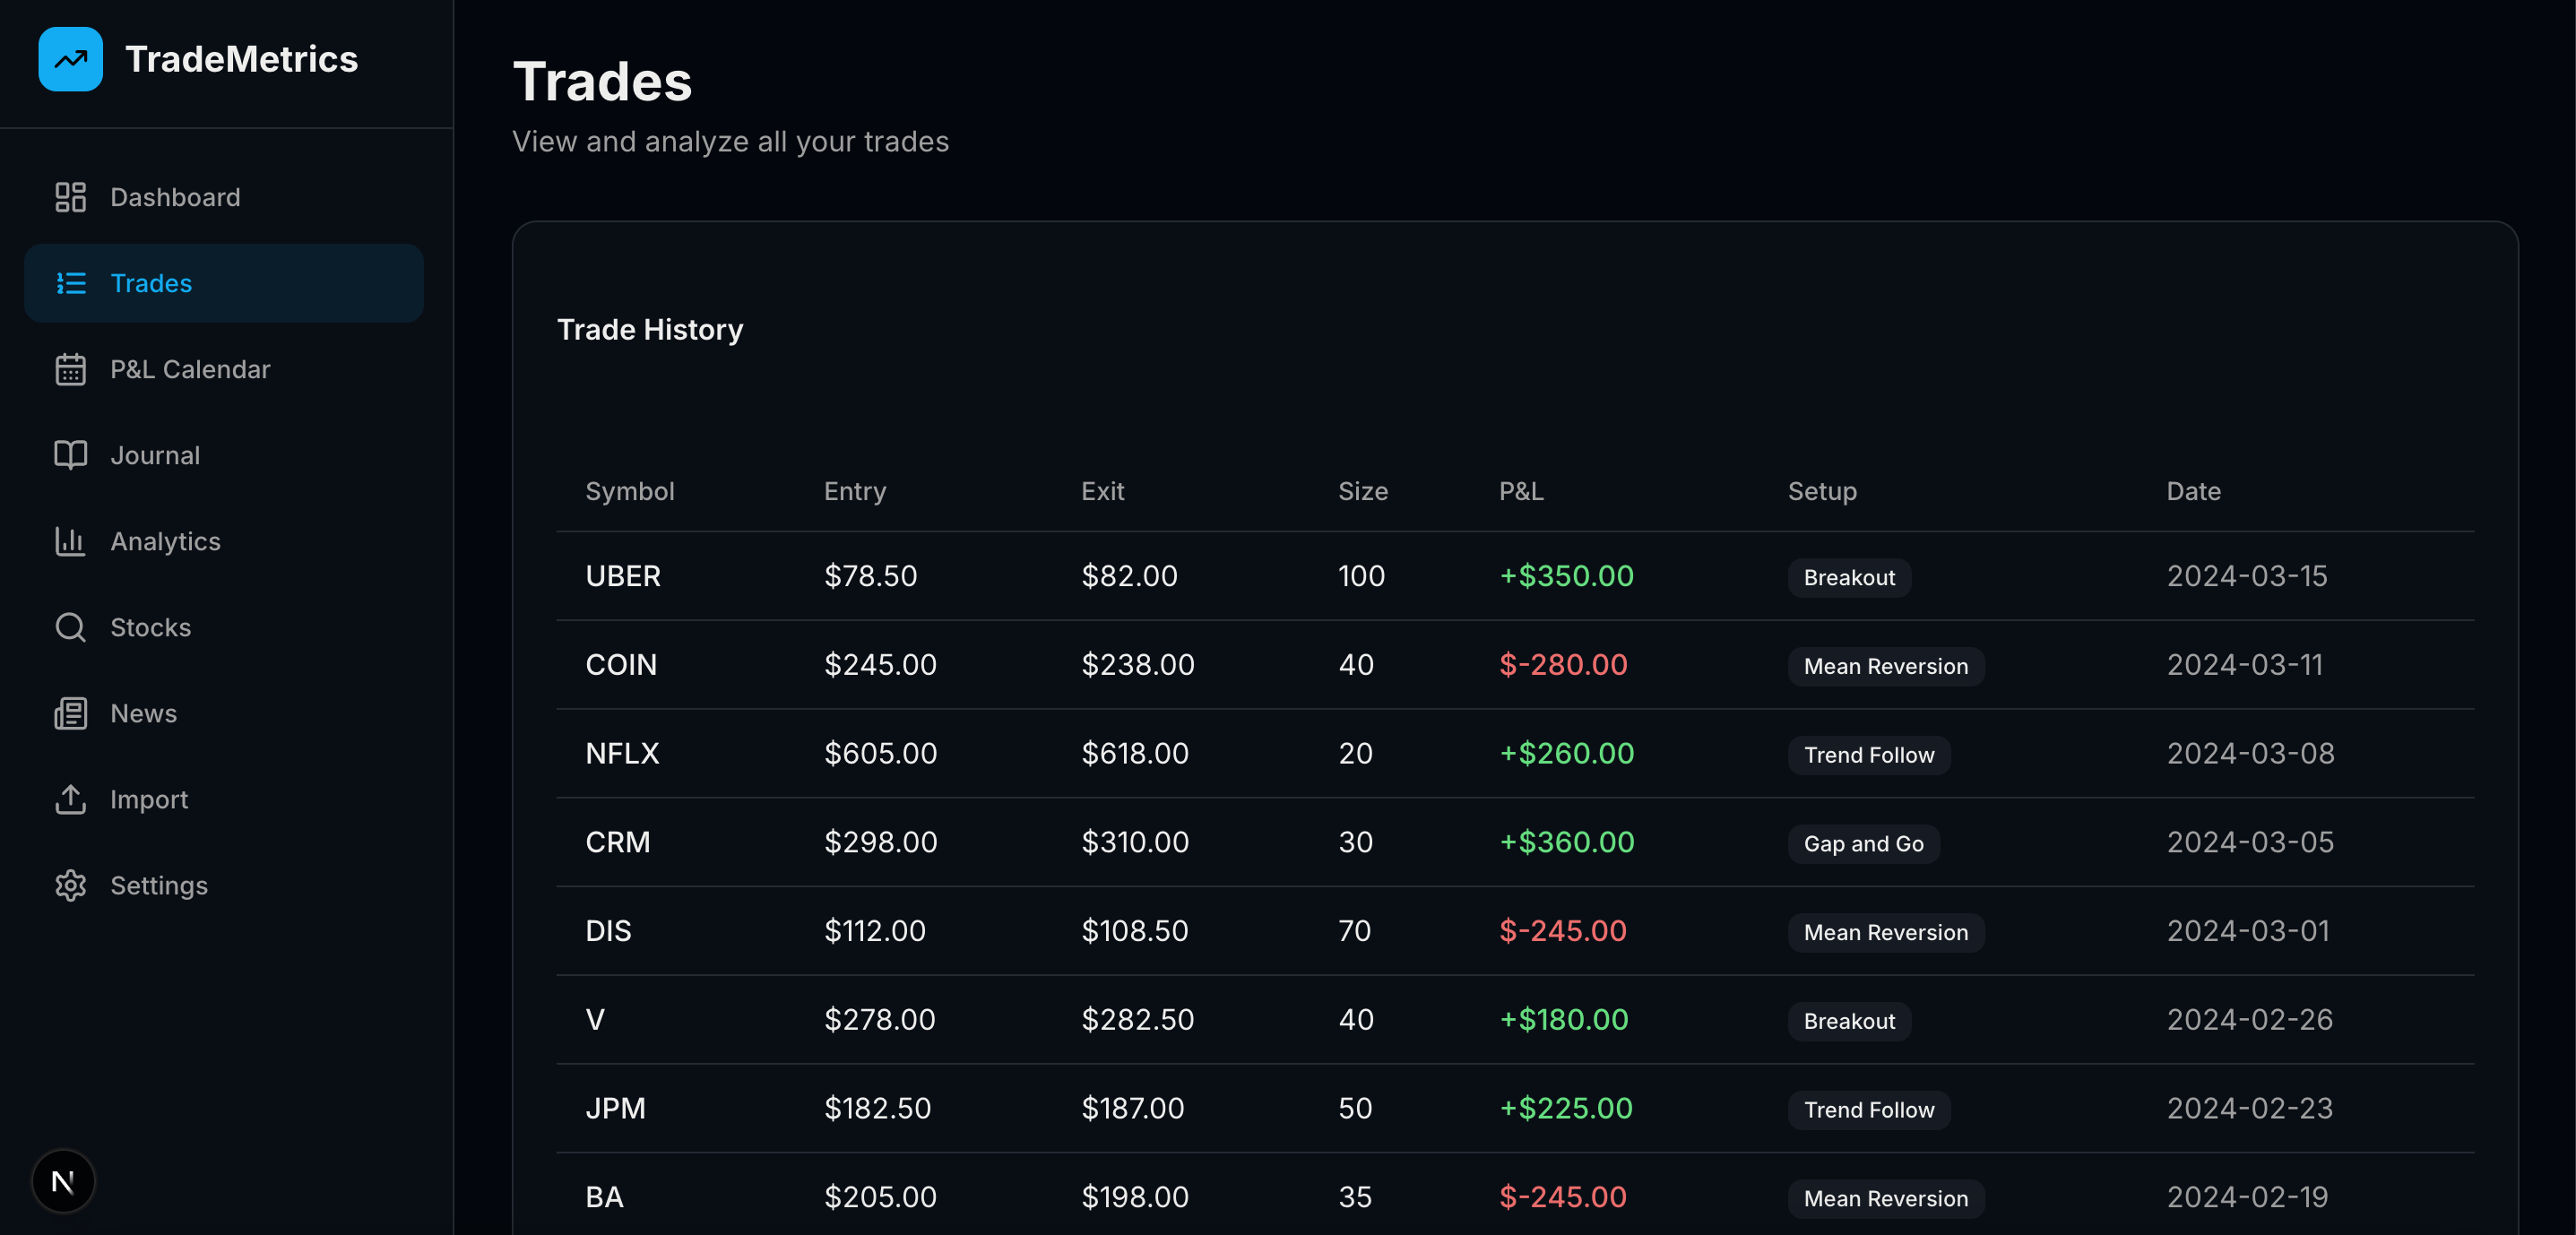
Data-driven insights
Analyze your performance by setup type, tags, symbols, and time periods. Discover which strategies work best for you and where you need improvement.
- Performance by setup and tags
- Symbol-level breakdown
- Customizable time ranges
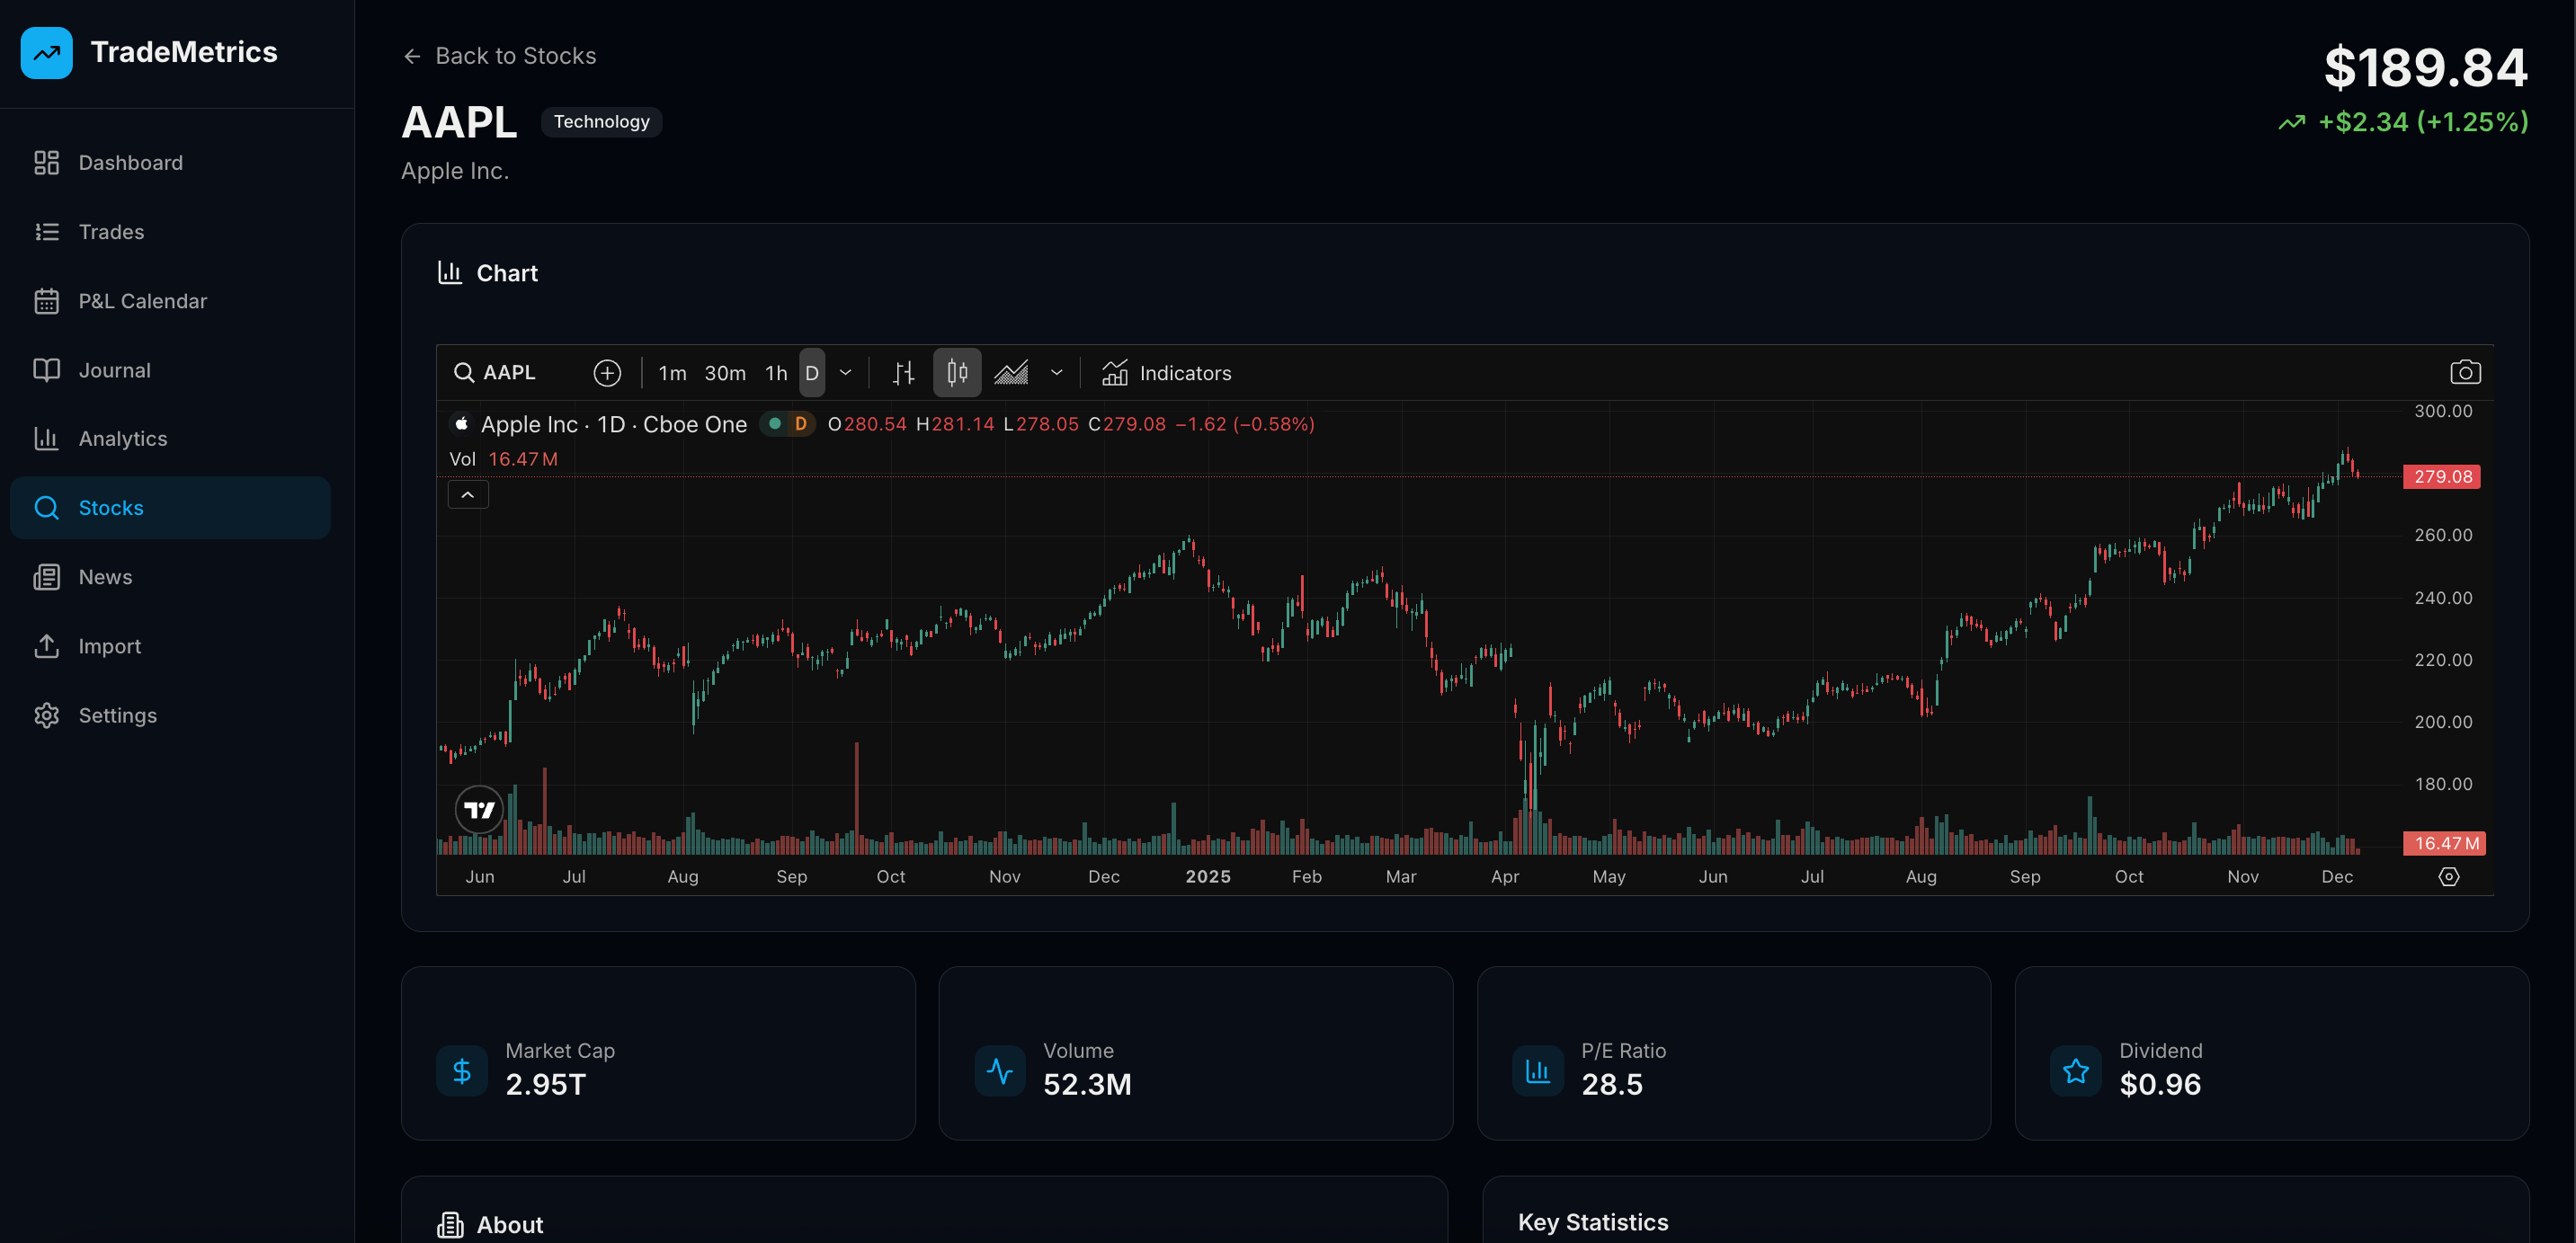
Research any stock
Search and analyze stocks with real-time prices, embedded TradingView charts, key statistics, and company information. Build and manage your personal watchlist.
- TradingView charts integration
- Real-time stock data
- Personal watchlist management
Simple, transparent pricing
Choose the plan that fits your trading journey
Free Trial
Try all Pro features free for 7 days
Then $14.99/month or downgrade to Free
- All Pro features for 7 days
- Unlimited trades
- Advanced analytics
- No credit card required
Pro Monthly
For serious traders
- Unlimited trades
- Advanced analytics
- Trade replay
- Unlimited journal sections
- Stock research
- Priority support
Pro Yearly
Best value for committed traders
Just $9.99/month
- Everything in Pro Monthly
- 2 months free
- Locked-in pricing
- Early access to new features
Frequently Asked Questions
Everything you need to know about TradeMetricX
What is a trading journal and why do I need one?+
A trading journal is a detailed record of all your trades, including entry/exit points, position sizes, P&L, and notes about your strategy and emotions. It's essential for identifying patterns in your trading behavior, understanding what works and what doesn't, and continuously improving your performance. TradeMetricX makes journaling effortless with automatic trade tracking, advanced analytics, and intuitive visualization tools.
How can TradeMetricX improve my trading performance?+
TradeMetricX provides data-driven insights that help you identify your strengths and weaknesses. Our advanced analytics show you which setups are most profitable, what times of day you trade best, and where you're losing money. The P&L calendar helps you spot consistency patterns, while the trade replay feature lets you review your entries and exits to improve timing. Many traders see measurable improvements in their win rate and profit factor within weeks of using TradeMetricX.
Is TradeMetricX free to use?+
Yes! TradeMetricX offers a free plan that includes up to 50 trades per month, basic analytics, P&L calendar, and a trading journal with 3 sections. This is perfect for getting started and experiencing the platform. For serious traders who need unlimited trades, advanced analytics, trade replay, and stock research features, we offer Pro plans starting at just $14.99/month (or $9.99/month when billed annually).
What brokers and trading platforms are supported?+
TradeMetricX supports CSV imports from major brokers including Robinhood, TD Ameritrade, Interactive Brokers, E*TRADE, Webull, and many others. You can also manually add trades for any broker or platform. Our flexible import system handles stocks, options, forex, and futures trades. If your broker provides trade data in CSV format, TradeMetricX can import it.
Is my trading data secure and private?+
Absolutely. Your trading data is stored securely in Firebase with industry-standard encryption. Each user's data is completely isolated and only accessible to you when logged in. We never share your trading data with third parties, and we don't have access to your brokerage accounts. Your privacy and security are our top priorities.
Can I use TradeMetricX for day trading, swing trading, or long-term investing?+
Yes! TradeMetricX is designed to work for all trading styles. Whether you're a day trader making dozens of trades per day, a swing trader holding positions for days or weeks, or a long-term investor, our platform adapts to your needs. The analytics automatically adjust to show relevant metrics for your trading style, and you can filter and analyze your performance by any time period.
See TradeMetricX in Action
Watch how TradeMetricX helps you journal and analyze your trades efficiently